Madame President? - Part Four
Thank you for all the great emails on my latest series “Madame President?” I don’t think I’ve ever heard such passion and interest in a topic in years.
I’ve heard from lots of women (and men) who went through the same experiences (including addiction) that I did - and suffer the same guilt and shame that I did and often still do. Many want to hear more.
I’ve also heard from lots of people who define themselves as people of faith, like myself, yet have had abortions themselves, or have a child who did, have children or grandchildren who conceived children out of wedlock or have children or grandchildren who have declared themselves atheists or LGBTQ. Often, I think these opposing factors can not only cause the faithful to experience shame but also encourage them NOT to vote. That’s the opposite of what America needs, IMHO.
I believe that many influences over the past 75 years (including TDS) have caused many families to struggle, even fracture, in this day and age. I hope that my experiences and research will help explain the why behind it all. If we don’t understand the cause of a problem, and we can’t explain it to others or campaign on it, we can’t hope to fix it, right?
I’m going to use Part 4 of my series on Madame President? to talk you through the “data” behind my conclusions before I continue to tell you the rest of my personal story. If you have a weak stomach or are easily offended, I suggest you stop reading now.
You’ve surely heard the phrase "demographics are destiny" - the idea that the size, composition, and trends of a population—such as age, race, fertility rates, and migration—fundamentally shape a society’s future, influencing its economy, politics, culture, and social structure over time. I am a researcher so I try to examine not only anecdotal information from my life and others - but also study the data behind it.
Let’s explore how demographics have influenced the American family and society over time - and the female role in it.
I believe that the Baby Boom generation (born 1946–1964), Lyndon B. Johnson’s Welfare State and Great Society programs of the 1960s, the Vietnam War with U.S. peak involvement from 1965–1973, and the legalization of abortion via Roe v. Wade in 1973 all worked together and profoundly shaped the American household and the role of women in it from the mid-20th century onward. These forces ALL interacted to redefine family structures, gender roles, economic dynamics, and reproductive choices, with lasting economic effects and psychological impacts today.
Below is an analysis of their collective impact, backed by historical data and trends - which I have compiled from dozens of AI searches.
The Baby Boom Generation
Demographic Impact: The Baby Boom produced 76 million births from 1946-1964. Households averaged about 3.4 people in the 1950s, reflecting large nuclear families. Marriage was near-universal with men as primary earners.
Women’s Role: Initially, women were homemakers; only 30% worked in 1950. Post-war prosperity reinforced traditional roles—median marriage age was 20.3 for women in 1950. By the 1970’s, however, Boomer women entered the workforce en masse (43% participation by 1970) - shrinking household size and increasing two-earner households.
Household Shift: Boomers delayed marriage and had fewer children, reflecting economic pressures and cultural shifts like feminism. Divorce rates rose boosting female-headed households.
LBJ’s Welfare State (Great Society)
Launched in 1964–1965, LBJ’s Great Society expanded welfare via Medicare, Medicaid, food stamps, and Aid to Families with Dependent Children (AFDC). It allegedly aimed to reduce poverty and support single-parent families, disproportionately headed by women.
Welfare programs enabled women to sustain households without male breadwinners, accelerating the rise of female-headed households. AFDC grew the number of female-headed households. Women’s workforce participation jumped to 51% by 1984, partly due to childcare support and job training.
Welfare reduced economic dependence on marriage, contributing to higher divorce (50% by 1980) and out-of-wedlock births (18% by 1980). The middle-class share of households dropped, with low-income households rising, effectively causing the opposite of what was intended.
The Vietnam War
Social Disruption: The Vietnam War drafted 2.2 million men, killed 58,000, and left many disabled, reshaping family dynamics. Women’s workforce participation rose as men were absent.
War widows and single mothers increased female-headed households. Anti-war protests and the left-wing counterculture of the 1960’s and 1970’s fueled women’s liberation. Boomer women, coming of age during this period, delayed marriage and entered professional white-collar fields.
Delayed family formation and rising divorce (Vietnam vets also had higher rates of divorce, about 38% vs. 33% for the general population) shrank households further. Two-earner households grew, with women contributing more income - changing the household dynamic and often creating a competitive climate.
Legalization of Abortion (Roe v. Wade, 1973)
Legalized in 1973, abortion rose from 200,000 in 1970 to 1.5 million annually by 1980, giving women unprecedented control over reproduction. Out-of-wedlock births still climbed, however.
Reproductive autonomy for women delayed childbirth and marriage. Women’s workforce participation rose and by 2020, 20% of dual-earner wives out-earned husbands.
Smaller families and fewer children per household became the norm. Single motherhood grew - as abortion decoupled sex from marriage, alongside divorce. Middle-class households shrank with low-income and high-income households expanding.
Baby Boom: The 76 million Boomers created a large cohort that initially reinforced traditional households but later, coupled with abortion, drove smaller families, higher divorce and women’s workforce entry.
Welfare State: By supporting single mothers, the welfare state enabled a rise in female-headed households.
Vietnam War: Drafting 2.2 million men disrupted young families, accelerating women’s economic roles and contributing to delayed marriage and shrinking household size.
Economic Destiny: A declining family size, below replacement, caused labor shortages unless they could be offset by immigration or a change toward reproduction.
Social Destiny: Aging Boomers (median age 68 by 2025) and smaller households forecast have increased elderly care demands while the once nuclear family fractured - making fear about social security and Medicare more pronounced - particularly by older women.
Demographic voting blocs - like Boomers voting in the 1970s (abortion focus) or Gen Z’s current LGBTQ focus - have radically influenced the political discourse and debate. Not to mention the modern day use of influencers on social media and in our public schools and WOKE churches - reaching younger and younger audiences.
In essence, "demographics are destiny" and this underscores how the Baby Boom’s scale, LBJ’s welfare safety net, Vietnam’s disruptions, and widespread abortion after Roe created a “perfect storm” of circumstances to impact the American family. It wasn’t just one thing - it was everything.
These shifts also influenced some women’s decisions to identify as bisexual or gay later in life, particularly if they felt unable to find a suitable male partner or were beyond childbearing years and seeking companionship rather than the need for traditional family roles.
Impact on Women’s Choices: By the 1970s–1980s, Boomer women faced a shrinking pool of traditional male partners due to higher divorce, war and delayed family formation. Beyond childbearing years, many turned to same-sex relationships for companionship, especially since societal pressure to marry and procreate waned. Research shows that 20–30% of women report same-sex attraction later in life, often post-heterosexual marriages. So, they weren’t “born that way” as many like to say.
Impact on Women’s Choices: Economic independence reduced reliance on men for financial stability, decoupling marriage from survival and led single mothers and divorced women to explore same-sex relationships for emotional rather than reproductive partnership. For Boomer women aging out of fertility, same-sex relationships offered companionship without the pressure of finding a “provider” man.
Religion: Declining “faithful households” weakened traditional norms against same-sex relationships, easing acceptance of gay marriage and same sex couplings.
Impact on Choices: These trends—smaller households, economic autonomy, and secularization—create a context where women beyond childbearing years (45–55) or disillusioned with men might choose bisexuality or lesbianism to avoid loneliness.
Research shows that women often identify as gay or bisexual because of the inability to find the “man they want.”
Marriage Market Squeeze: Vietnam reduced eligible men in the 1960s–1970s, while Boomers’ high divorce rates and delayed marriage shrank the pool of “ideal” partners—stable, provider-types aligned with 1950s norms. Women’s rising standards, based on their own earnings potential, may also make men less appealing if they don’t match or exceed expectations, per studies showing 25% of women cite male dissatisfaction as they reason they seek out women for companionship.
Women who are unable to find a desired male partner - due to scarcity or expectations - or are beyond childbearing years (and no longer able to procreate or be desirable to a younger male) might identify as bisexual or gay to avoid isolation or “dying alone.”
Studies suggest this could involve 20% of women today who are over 40, and 30% of Gen Z women. Think about that.
By 2025, these forces have created a landscape where women’s choice to identify as bisexual or gay reflects a way to avoid loneliness, rooted in demographic shifts since 1945. This would also explain why 70% of women support transgender rights and 50% support sex change surgeries for minors and young adults because they are projecting their own experiences with abortion onto others.
This would also explain why many older women are SO ANGRY and did NOT vote for Trump and why so many voted for Kamala Harris - even though she was obviously not up to the task.
As I reported earlier, research also shows that 2-3 times as many Gen Z women (13-28) identify as gay, bisexual or transgender compared to men. Obviously, these women are still in child-bearing years and not seeking old-age companionship.
However, they are being INFLUENCED on social media, in public schools and WOKE churches by older women who did and are. U.S. public schools began teaching children about same-sex relationships in the 1980s with the AIDS crisis, with formal inclusion in curricula starting in the 2000s and 2010s in progressive states. The same goes for advertising campaigns that distort reality and push anti-male, LGBTQ and anti-white propaganda. I call this grooming and projection and it’s been going on for decades. This is one HUGE reason why we need to get rid of the Department of Education and allow teachers to teach - not spread propaganda.
Research also shows that 80% of men who identify as gay do so because their FIRST sexual experience was with a man. Many gay men also consider themselves bisexual and can be attracted to women, but they PREFER sex with a man and are more AROUSED by men because it mirrors their first encounter.
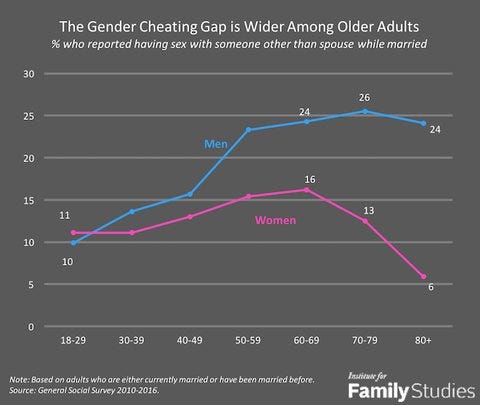
Finally, the last factor I examined was why men and women cheat and how that impacts the family dynamic and particularly why it angers older women - because it does. According to an old survey I found, contrary to what people think, men and women cheat at about the same rate until age 40-50.
On average, 1 out of 5 married people will cheat on their spouses in their 20s and 30s. When married men get older - post 60 - they start to cheat like crazy and women do not. Why? 95% of women experience menopause between 45 and 55.
So, as you can see, Demographics can shape Destiny, but are they permanent? I don’t think so. Some of these dynamics can be changed for the better - particularly when it comes to INFLUENCING children and helping ease the LONELINESS and FEAR of older women. What will that take? A willingness to acknowledge the truth and come up with a plan to change it. If a pro-life woman wants to be President - that’s what I think she needs to do.
Here are charts of research that I used to prepare this summary, in no particular order. I examined ten year periods from post-WW2 baby boom to today to show trends. As you will see, this didn’t happen overnight and we won’t fix it overnight - but we can START today. With God’s help - all things are possible.
Trump Vote Percentage by Age Group and Gender
% of Two-Earner Households
20-25% in 1945, 55-58% today
Foreign born workers and migration
5-7% in 1945, 17-19% today
% of Middle Class Households
60-65% in 1945, 50-51% today
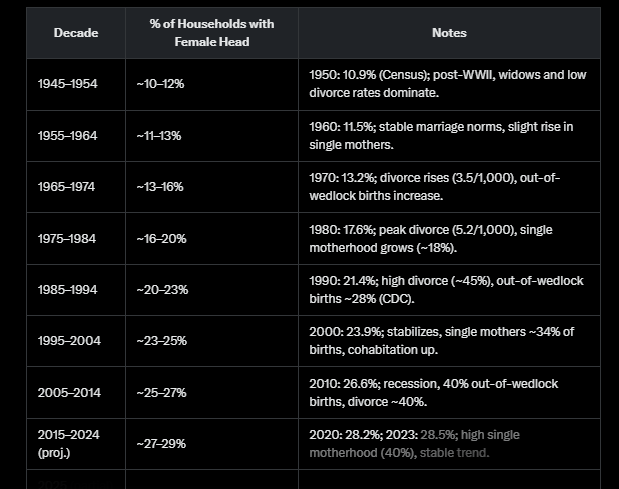
Percent Households with Female Head
10-12% in 1945, 27-29% today
Average Household Size
3.4 in 1945, 2.5 today
Percent of Gen Z who identify as gay/lesbian, bisexual or transgender
31% women, 12% men
Blue-collar and white-collar % of workforce
Blue-collar: 50-55% in 1945, 18-22% today
White-collar: 45-50% in 1945, 78-82% today (include Federal Government here too)
Percent of Two-Earner Households where women earn more
2-5% in 1945, 25-28% today
Percent of gay men and lesbian women who had a same-sex first encounter
60-70% men
30-40% women
PS: Lisa Diamond’s Work and notably her book Sexual Fluidity: Understanding Women’s Love and Desire, tracked women over a decade and found that 20–30% of women who initially identified as heterosexual reported same-sex attraction or behavior later in life, suggesting that women’s attractions can be coerced - rather than being fixed early on. She also found that women are attracted to other women for companionship and men are attracted to other men for arousal. Two very different motivations.
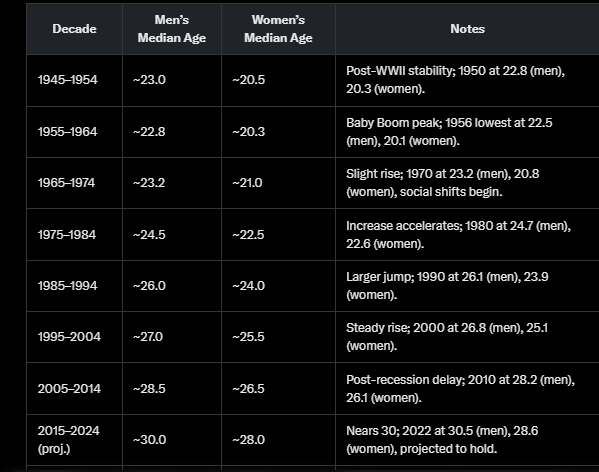
Median Age at Marriage by Gender
Consider that primary child-bearing years for women are 20-34. In 2025, women are marrying later at age 28 and have only 7 peak years for child-bearing left.
Percent of Marriages Ending in Divorce
25% in 1945, 35-37% today after peaking at 50% in the 1980s
Replacement Birthrate Needed VS Actual
2.1 is needed replacement rate
3.5 in 1945, 1.7 today - we aren’t replacing ourselves through childbirth and haven’t done so for the past 30 years
Life Expectancy by Gender
Women live 5 years longer than men - consistent
Ratio of Living Men to Living Women at Age Intervals
During child-bearing years, the number of men and women are about the same. But, note that starting at around age 40, women start to significantly outnumber men. By age 70, there are only 85 men for every 100 women.
Estimated Births and Abortions by Decade
Massive abortions occurred during 1975-2004 and are declining slightly
Percentage of Births Out of Wedlock
4% in 1945, 40-41% today
% of Religious Households
70-80% in 1945, 35-45% today
Cheating By Gender and Age
Men cheat much more than women past age 50 when women reach menopause
I’m sure I could have analyzed many more charts and factors but I think I uncovered the key issues that have worked together to shape our “culture” of today. I know that many of you know these things “intuitively” but I highly doubt you’ve ever seen them addressed in a comprehensive and cohesive manner or have engaged others in a discussion about them - based on real-world data.
In order to help shape the future America we want to live in, we need to define what that means - and then tackle the issues together we can change, educate future generations on that change and make sure we elect candidates who can accomplish that vision.
In the next Chapter of my series, I’ll tell you more of my personal story and what else I learned about myself and others - relative to this topic.
Feel free to reply to this newsletter with your own life experiences or send me questions or comments you’d like me to address in future segments. Godspeed.
Madame President? - Part One
Madame President? - Part Two
Madame President? - Part Three
Madame President? - Part Four
Madame President? - Part Five
My work is free and supported by your generous donations. Thank you to all who have donated in the past. I truly appreciate your generosity!
If you like my work, you can fund me by becoming a paid subscriber on Substack, donate by credit card here or you can send me a check to Peggy Tierney, PO Box 242, Spooner, Wisconsin 54801. Or just send me a note or a card through the mail or an email at TierneyRealNewsNetwork@substack.com! I love hearing from you.


